• Home
  • About
    • Company Profile
    • Contact Leanmap
    • Engagement Model
    • Experts on Demand
    • Improvement Process
  • Consulting
    • Operations Diagnostics
    • Lean Transformation
    • Quality Excellence
    • Cost Reduction
  • Audits
    • Operations Health Check
    • Lean Factory Audit
    • Lean Office Audit
    • Lean Certification
  • Academy
    • Online Certification
    • Agile Lean Six Sigma
    • Problem Solving Skills
    • Strategy Deployment
    • Performance Management
  • Shop
    • Products & Services
    • Membership Options
  • News
  • Portal
  • Login
  • My Account
  • en English
    ar Arabicbg Bulgarianzh-CN Chinese (Simplified)cs Czechda Danishnl Dutchen Englishfi Finnishfr Frenchde Germanel Greekhi Hindihu Hungarianit Italianja Japaneseko Koreanno Norwegianpl Polishpt Portuguesero Romanianru Russianes Spanishsv Swedishtr Turkish

Visual Management: Efficiency from Transparency

September 18, 2018

Visual management refers to the placement

of tools, parts, processes, indicators in view, so the status of the system can be understood at a glance.  Visual management devices relay information through signals (cards, marks, lights, bins) instead of reports. Visual management is often faster, cheaper, and more effective than any other information system by indicating normal and abnormal conditions without the use of time-consuming reports or complex systems. In essence, visuals allow you to lead with what you can see.

A business should be run like an aquarium, where everybody can see what’s going on–what’s going in, what’s moving around, what’s coming out. That’s the only way to make sure people understand what you’re doing, and why, and have some input into deciding where you are going. Then, when the unexpected happens, they know how to react and react quickly.

Jack Stack "Open Book Management"

The guiding principle is this: Every employee, straight down to the janitor, should know the company’s numbers, being informed about quality, delivery, revenues and costs. The rationale of doing this: If everyone down the line has a basic understanding of current requirements, resources, and results (3R), then each employee would be informed enough to improve products, services, and costs. Furthermore, educated and informed employees feel more secure and are more loyal employees.

How to implement visual management

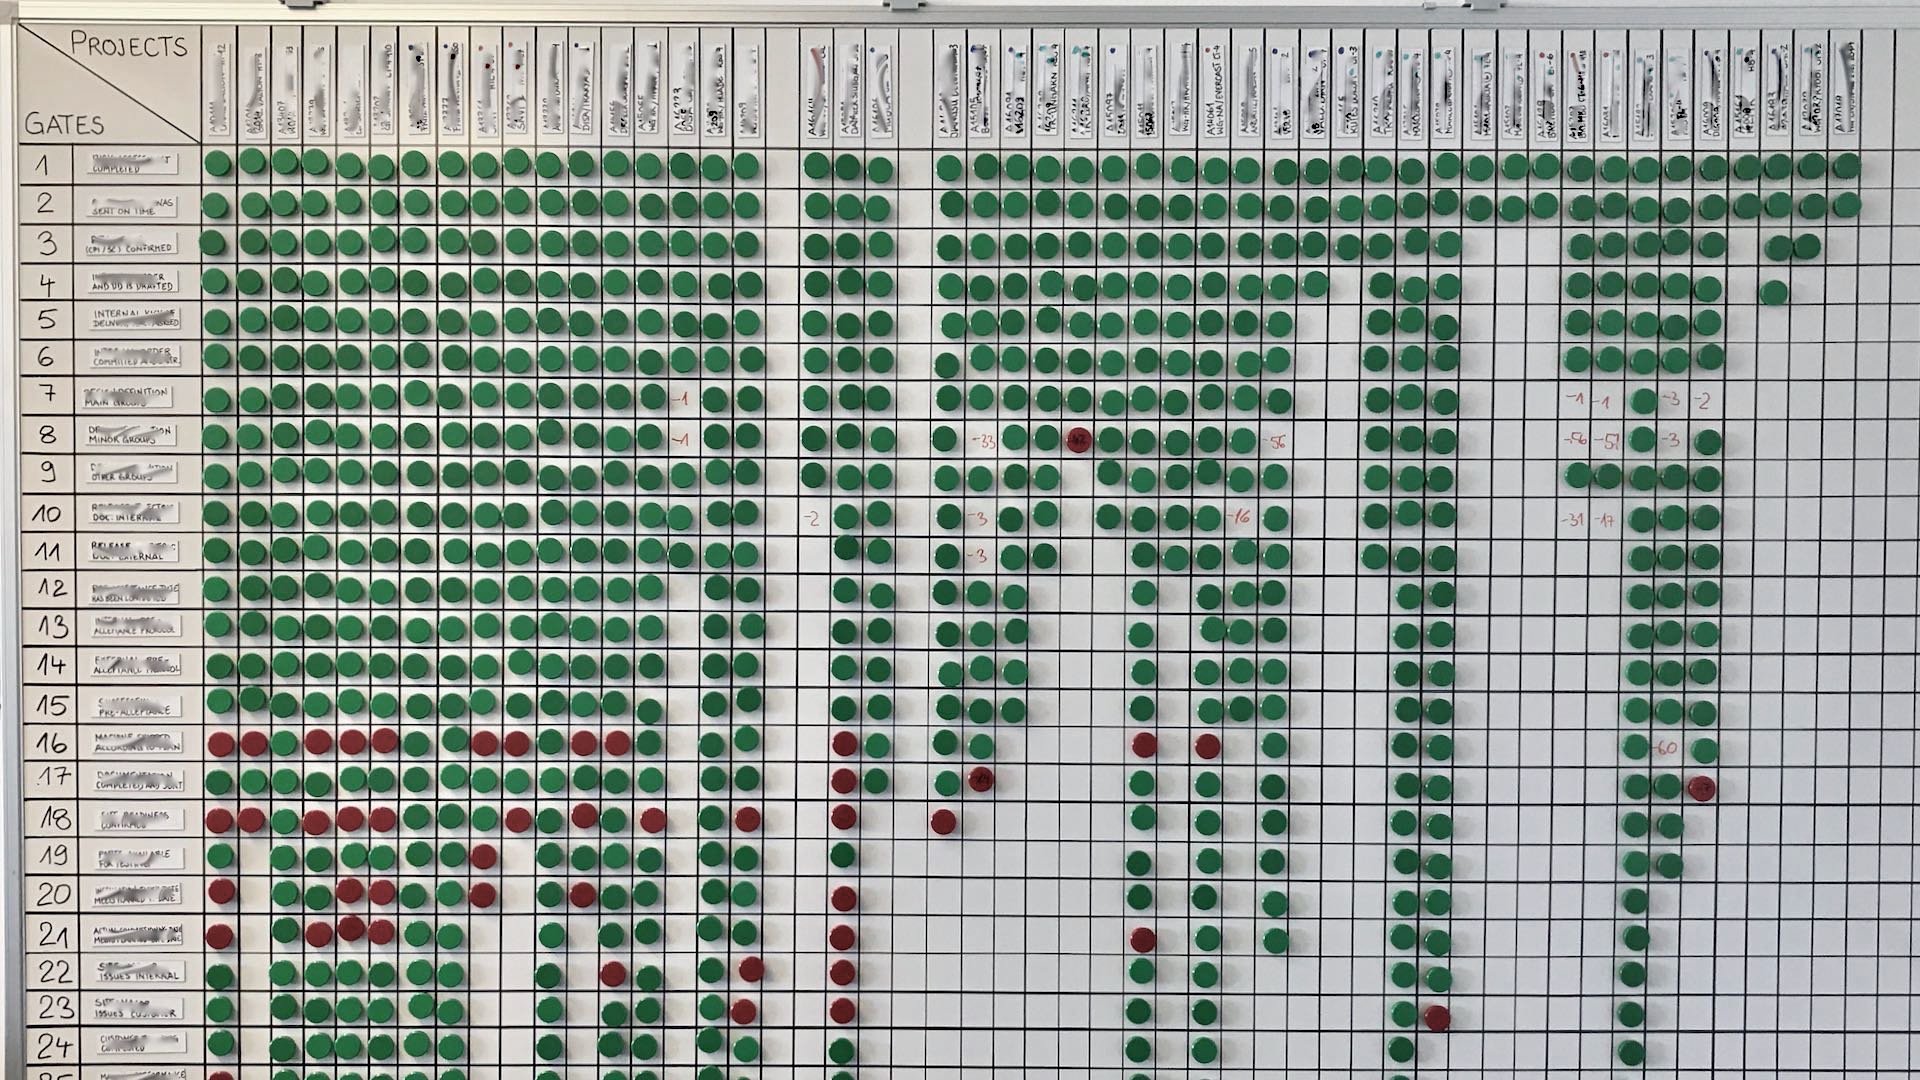
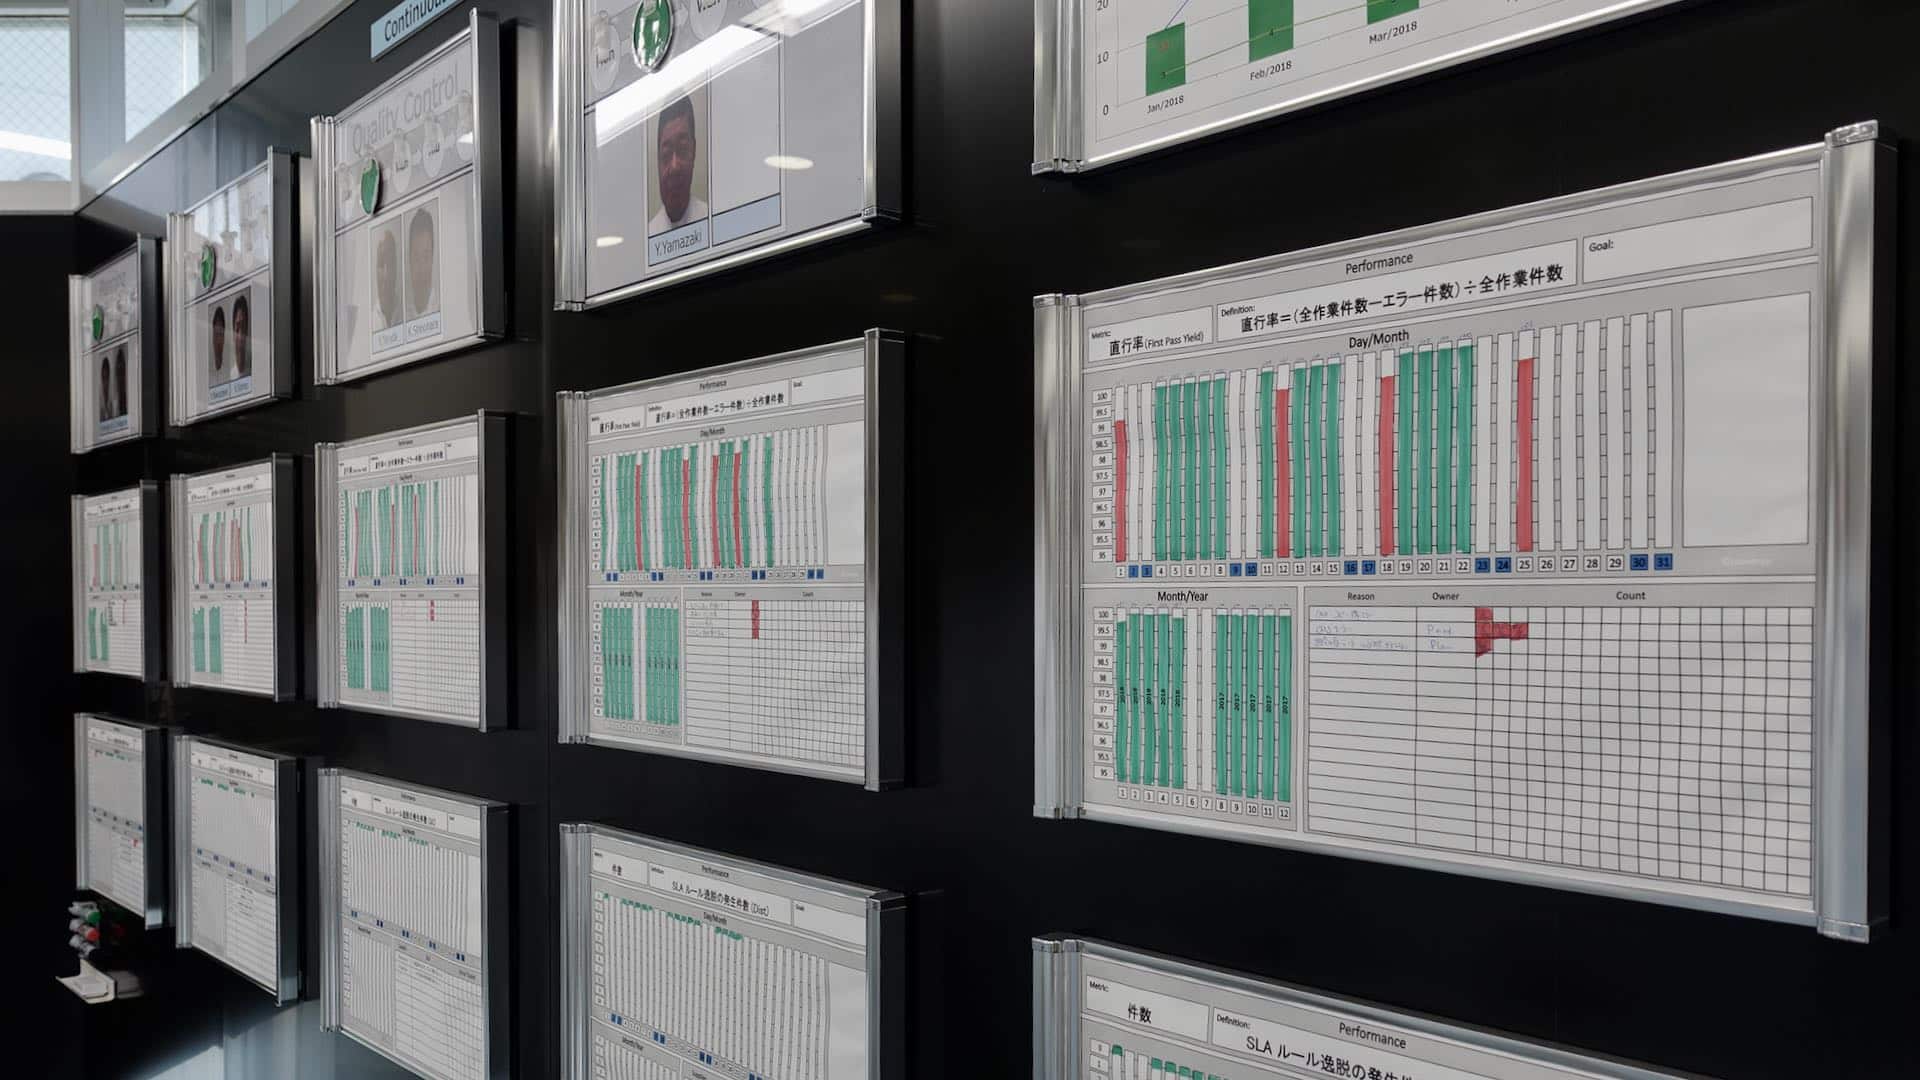
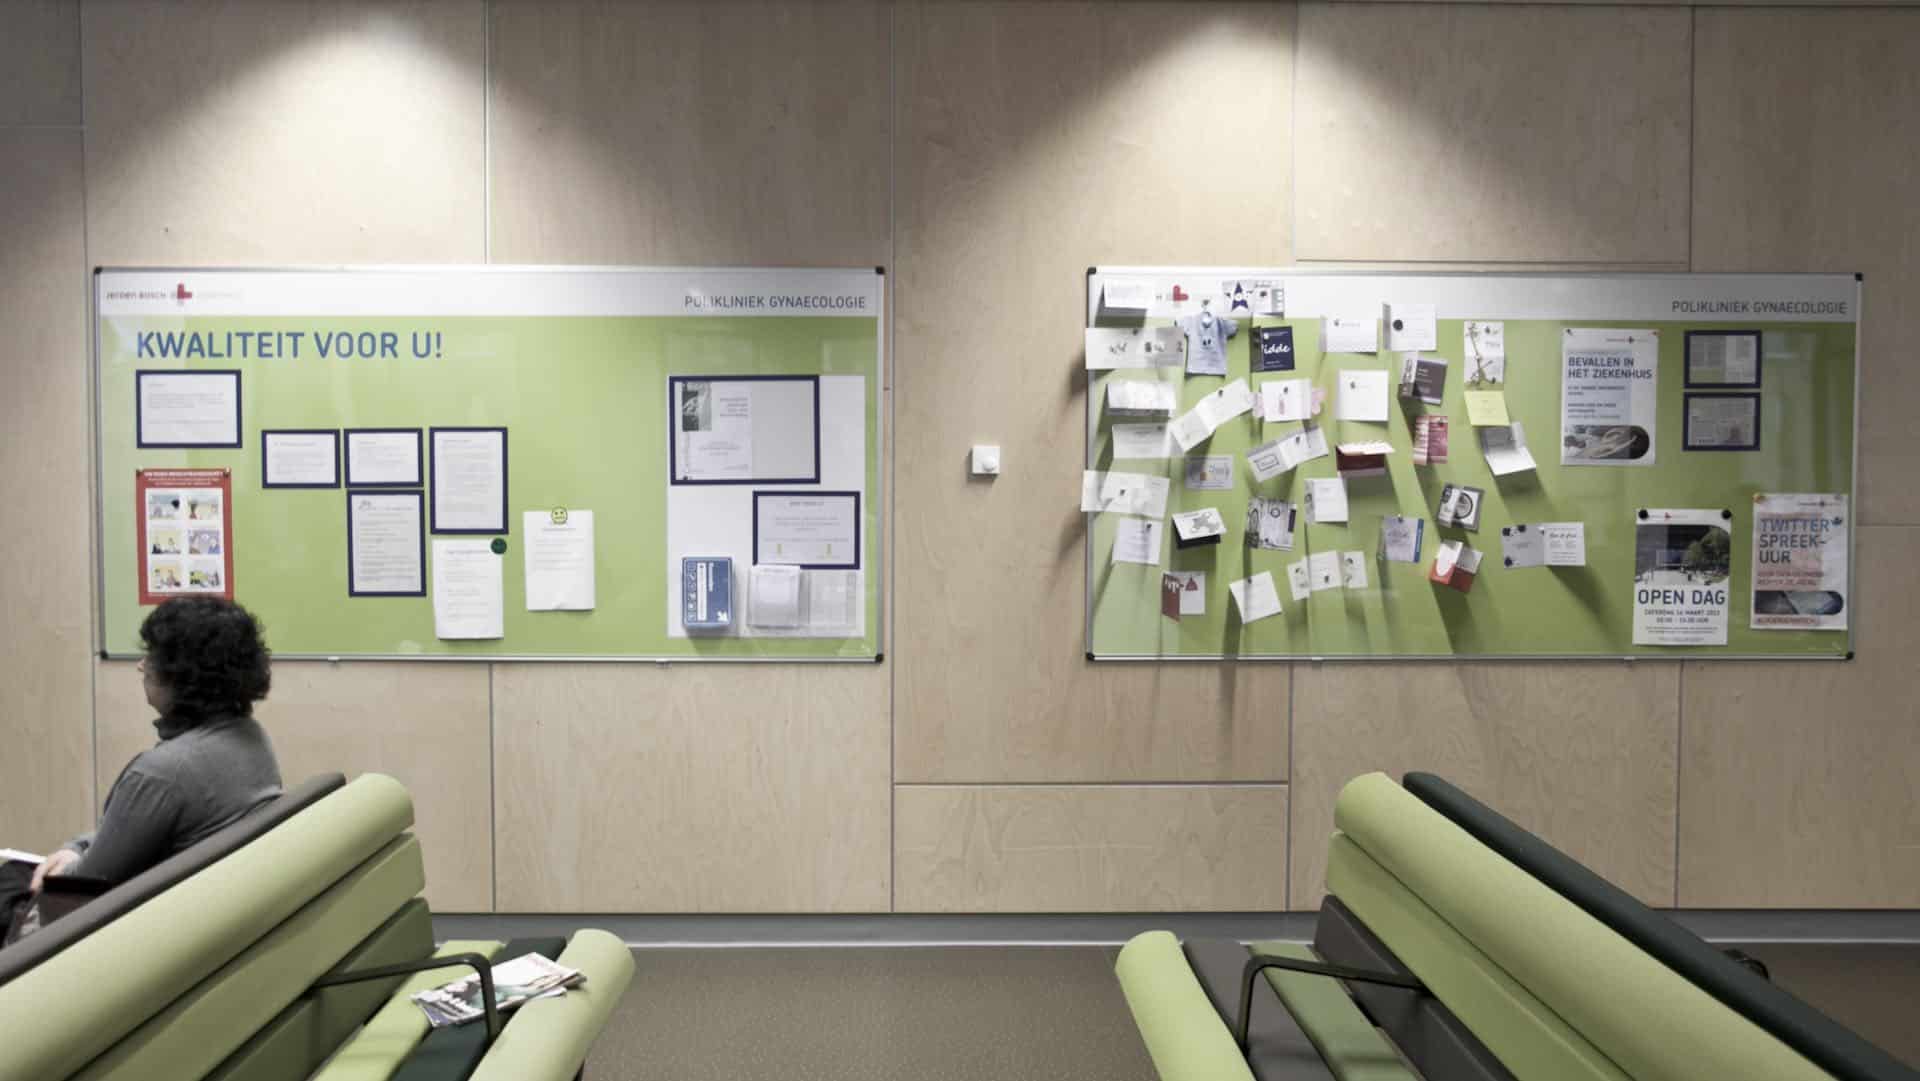
Visual tools must serve people by relaying information in an easy-to-understand format. To be effective, status boards, information monitors, and other visual devices (cards, marks, lights, bins) must meet the following three checkpoints to be effective:

  • Readable at a distance of 3 meters or 10 feet
  • Understandable at a glance, within 3 seconds
  • Indicate status in red (must act) and green (ok)

Visual Management Examples

Good Visual Project Status Board
Good Visual Management Board
Confusing Visual Management Board
Visual Management – Poor Setup

Visual Management Applications

Performance Management

I want to systematically meet targets
See How

Strategy Deployment

I want to turn vision into reality
See How
Post Views: 436

Filed Under: Insights | Observations | Learnings Tagged With: Performance Management, Strategy Deployment

Footer

We help our clients boost performance levels by solving operational constraints, rationalizing processes, and bringing mission-critical projects back on track – Navigating to Results.

News

  • Change Management: The 7 Success Factors and 7 Failure Reasons...

    Jan 10th, 2021

  • Lean Team Trioplast France

    Plastic Production: Increasing Yield, Flow, Resilience during Pandemic...

    Dec 30th, 2020

  • Root Cause Analysis: Using Logic Trees to Solve Critical and Complex Problems...

    Dec 3rd, 2020

Categories

  • Certifications | Bronze | Silver | Gold
  • Engagements | Programs | Projects
  • Insights | Observations | Learnings
  • Training | Yellow | Green | Black Belt

SERVICES

  • Assess Operations
  • Download Tools
  • Get Certified

Copyright © 2005-2021 Leanmap | Privacy | Terms | Contact | Feedback