The Cost Reduction Program (CRP) allows clients to meet their budget and achieve a healthier cost base, while creating a lasting competitive advantage.
Cost efficiency remains a perennial challenge. Ongoing price erosion adds pressure on organizations to better manage expenses and efficiency to protect the bottom line. Cost savings can be created throughout the entire economic cycle, from inception to phaseout. In order to prevent costs bouncing back, improvements must be systemized and embedded to effectively address the roots that cause over 90% cost-cutting initiatives to fail. Watch the video about developing a profit improvement program that delivers significant, sustainable savings.
Cases, when to use it:
- Budget missed, declining margin, losing money
- Costs out of control, attempts to reduce failed
- Eroding competitiveness, worry about the future
Clients, for whom it is:
- Leaders (CEO, CFO, COO)
- Functional managers
- Owners and investors
Process, how it works:
- Develop financial model for value stream
- Identify cost drivers and reduction levers
- Define cost reduction strategy and program
Benefits, what to gain:
- Financial drivers and levers are well understood
- Clear strategy and roadmap to achieve target cost
- Gain back freedom, control over financial destiny
Getting Back to Financial Health and Cost Competitiveness
Cost-Reduction Model to Achieve Financial Excellence
Achieving financial excellence requires a solid structure that defines spending categories and impact areas, key strategies, cost improvement tools and techniques, and the required skills and capabilities to address levers and deliver cost savings. To be effective, the cost-reduction framework must cover all savings opportunities, such as defects, rework, returns, excess capacity, idle time, organizational slack, under-utilization, overproduction, raw materials variation, over-processing, over-specification, excess precision, unnecessary features, non-value complexity, inflated inventory, inflexibility, unleveled labor allocation, and excess overhead, maintenance, utilities, facilities. Here are the most common categories, strategies, tools and skills to deliver cost savings:
Reduction Strategies:
- Demand management
- Process efficiency
- Technology alignment
- Organisational agility
- Business effectiveness
Improvement Tools:
- Zero-based budgeting
- Activity-based costing
- Should-cost modeling
- Design to cost (DTC)
- Fit for Purpose (FFP)
Cost Categories:
- Material cost per bill of materials (BOM)
- People cost per bill of activities (BOA)
- Failure or non-performance cost (NPC)
- Structure cost or ‘lights-on cost’ (LOC)
Why and When Embarking on a Financial Improvement Program?
Spending discipline is not a popular topic, but a necessary one for business management. And because costs naturally increase over time, most companies embark on periodic cutting initiatives to reduce expenses, optimize cash flow, and improve profitability. Those measures become a top priority when a company is in financial distress and during economic slowdowns, usually with focus on headcount reduction, capital expense elimination, and project deferral. Such reactive approach is not only demoralizing but also largely ineffective. As a result, most companies pursuing cost cutting not only fail to meet their targets, but find themselves in a weaker position, with costs bouncing back and competitiveness severely eroded. Contact us for a complimentary scoping call.
Why Spending Increase Over Time? Watch the Cost Inflators!
If not controlled, spending naturally increase over time, mainly driven by the lack of information and human behavior:
- Managers prefer to grow and expand, rather than to cut and reduce.
- Value-driven thinking and behavior is not encouraged and supported.
- Staying busy by expanding work to fill the time available for its completion “Parkinson’s Law“.
- Managers avoid the difficult decisions to reduce resources to match demand.
- Cost is out of focus during good times, building waste into products and processes.
- Cost reduction programs are often avoided as they could dampen morale.
- Adding unpaid extras or unnecessary features due to lack of customer knowledge.
- Excessive quality or service level in an attempt to “over-satisfy” customers.
- Additional inspection and sorting in an attempt to control quality.
- Excessive maintenance in fear of breakdowns due to lack of risk-cost knowledge.
- Adding fixed rather than variable resources to cope with peak demand.
The 3 Best Practices for Cost Transformation
Top performers know that each dollar earned in sales contributes only a small percentage to profit, while each dollar saved goes directly to the bottom line. They achieve about half of their profit improvements directly from cost reductions by doing three things differently.
- First, they act early before getting into distress, following the principle ”do as long you can before you must and can’t”.
- Second, they go beyond the short-term cost containment and create structural cost advantages that are hard to replicate.
- Third, they embed continuous cost reduction discipline in their way of working, make those tasks and integral part of life.
By doing so, they develop a capacity to recognize downturns early, respond rapidly, and reduce costs relentlessly, while creating unexpected opportunities from those cost transformation efforts. In a deep downturn, such instinct, coupled with a disciplined process, helps stabilizing the business and creates a launchpad for future growth.
Lowering Costs in a Significant and Sustainable Way
Important is to have a clear strategy before arbitrarily cutting costs, classifying costs as good costs and bad costs. Good costs serve customers and enable growth, while bad costs do not add value to customers or business. Rather than the traditional cost-cutting approach, our Cost Reduction Program creates value for companies looking for significant and sustainable gains, not only by reducing bad costs and rethinking requirements, but also by freeing up resources and deploying them in more productive areas. And because our CRP approach creates new processes and perspectives, it allows your team to discover new ways that cost reductions can unlock growth. Through the application of Lean principles and standards, we ensure cost improvements will be embedded in the way of working (WOW), to create not only bottom-line savings, but also to improve customer satisfaction from more consistent quality and delivery.
Top 10 Cost-Reduction Tactics to Launch the Program Quickly
Cost reduction is a positive approach to systematically reduce expenditures. Through a continuous, corrective process it achieves a permanent reduction in the unit cost of goods sold (COGS) or services rendered without impairing suitability or quality, the fit/form/function (3F) of the output. To launch a financail improvement program quickly, consider the following 10 tactics for the initial cost reduction roadmap.
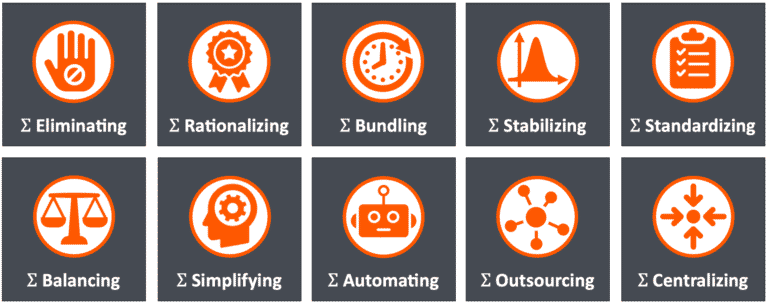
1. Eliminating activities that have not been requested and have no clear benefit.
2. Rationalizing quality and service levels to prevent overprocessing (excess precision, excess amount).
3. Bundling products and services together as single packaged units so they can be purchased at discounted prices.
4. Stabilizing processes to establish capability (Cpk), preventing defects, rework, double-handling and backflow.
5. Standardizing processes to get the same result every time, prevent variations between people and shifts.
6. Balancing resources to demand reduces overload and idling (requires cross-skilling and flexibilizing resources).
7. Simplifying products through modularization and streamlining workflows by taking out unnecessary steps, features.
8. Automating activities to reduce labor content, using fixed, programmable, and flexibile automation devices.
9. Outsourcing non-core activities to less-costly providers and specialists rather than doing them in-house.
10. Centralizing resources and information to reduce duplication and to concentrate knowledge and authority.
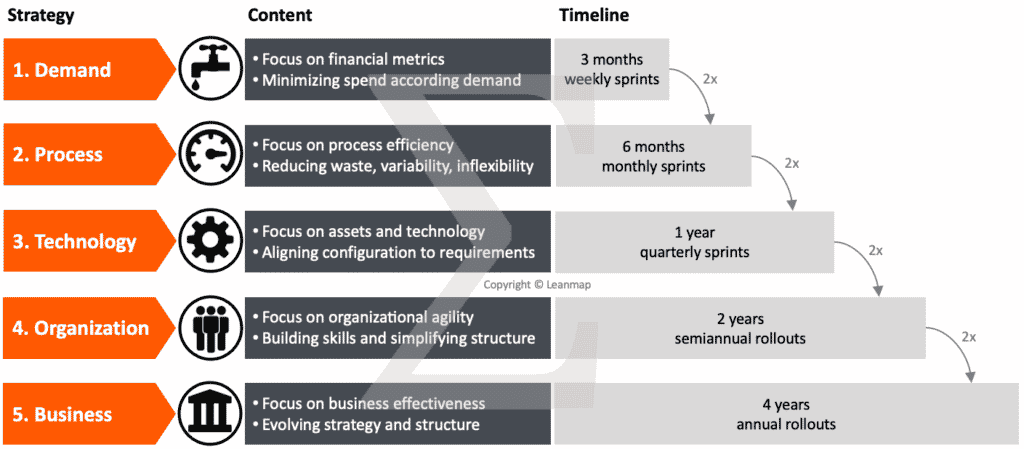
The 5 Proven Cost Reduction Strategies
To develop a comprehensive financial improvement program, there are five proven strategies that can be implemented sequentially or in parallel, each with a specific scope and timeline, from 3 months to 4 years. The full-scale program delivers significant cost savings over a period of 4-8 years.
1. Demand Management: reducing spend and leveling resources to demand over a 3-month period.
2. Process Efficiency: reducing waste, variability, inflexibility (Lean Transformation) over a 6-month period.
3. Technology Alignment: adjusting configurations and settings to requirements over a 1-year period.
4. Organization Agility: building skills, simplifying structure, and flatten the hierarchy over a 2-year period.
5. Business Effectiveness: realigning strategy and business model to evolving needs over a 4-year period.
The Cost Reduction Roadmap is Based on 5 Strategies and 68 Tactics
To be effective, reduction must be real by permanently removing wastes and costs from the system, not just shifting them to other departments or reassigning them to another cost centers.
This means permanently improving productivity by producing more with the same resources or producing the same level of output with fewer resources. Cost reductions are also achieved by right-sizing service and quality to exactly meet demand, not more and not less, preventing over-processing, e.g. excess precision or additional services that customers have not asked for, or are not willing to pay for.
Lowering the cost base also involves using lower-cost materials, eliminating unnecessary items and features, simplifying the manufacturing and service process, and substituting parts and materials without sacrificing the quality of the finished good. This point is critical; any cost reduction activity must not affect the fit, form, function (3F) of the good manufactured and service rendered, or else the change must be validated by the customer and potential gains may be shared.
Conclusion: An effective financial improvement program creates reductions that are real and permanent. For the 5 cost reduction strategies, there are 68+ proven tools, tactics, techniques that can be used to develop such a master plan for improving profitability.

1. Demand Management Tactics
- Demand-driven resource allocation (ROI) to eliminate organizational slack
- Bundling activities to reduce labor content
- Batch-size alignment to production, distribution, consumption
- Volume bundling and category management
- Volume shift to best-price supplier
- Global sourcing, shift to low cost country (LCC)
- Target pricing and price renegotiation
- Supplier qualification and second-tier sourcing
- Payment terms, accounts payable
- Multi-year contracts and life-cycle contracts
- Purchasing cooperation and mutualizing (Keiretsu)
- Transport optimization by frequency and amount
- E-auction tendering
- Purchasing controls to prevent maverick buying (bypassing process)

2. Process Efficiency Tactics
- Defect reduction and error-proofing
- Process capability (Cp, Cpk)
- Availability and reliability of tools and equipment
- Overall equipment effectiveness (OEE)
- Overall process effectiveness (OPE) for manual processes
- Overall factory effectiveness (OFE) for the entire plant
- Workload leveling to reduce idling and overload
- Quality and service level rationalization
- Specification downgrading to prevent over-processing
- Process streamlining, complexity reduction, simplification
- Standardization (OPL, SLA, SOP)
- Modularization and platforming
- Shared service center to consolidate back-office work
- Make-buy optimization
- Lean Transformation

3. Technology Alignment Tactics
- Inventory adjustment by risk and velocity
- Business-driven capex allocation (ROI)
- Decisions based on total cost of ownership (TOC)
- Rationalization of support and maintenance activities
- Consolidation of facilities, right-sizing capacity to demand
- Process and technology harmonization
- System supplier development
- Early customer involvement, joint development programs
- Concept competition
- Concurrent engineering
- Design for manufacturing and assembly (DFMA)
- Robotic process automation (RPA)
- Consignment warehousing
- Vendor-managed inventory (VMI)
- System redesign based on technical benchmarking

4. Organisational Agility Tactics
- Rightsizing staff
- Re-alignment based on contributions (BVA)
- Job design based on requirement analysis
- Job profile and pay level harmonization
- Joint development with supplier
- Centralization of support functions
- Roles and responsibilities standardization
- Streamlining of reporting
- Flatten hierarchy, reduction of layers, increasing spans
- Consolidation of duplicate organizations
- Incentive scheme optimization
- Organizational redesign based on benchmarking
- Tighten bonus, tougher targets, reduced pay-out
- Shift from full-time to part-time or contractor

5. Business Effectiveness Tactics
- Evolving the business model
- Value-driven business proposition, altering company value-add
- Centralized versus decentralized control
- Outsourcing of non-core manufacturing and service activities
- Collaboration groups (Keiretsu)
- Business scope shift
- Business model realignment
- Footprint rationalization
- Joint ventures for scalability
- Acquisitions for greater control
- Rationalize product and service portfolios
How Can Leanmap Help Saving Money? How Does the Program Work?
How it works:
Together with your team we review manufacturing processes and service processes and administrative process. In a focused cost reduction workshop we jointly identify cost reduction opportunities by analyzing the current cost structure, using value driver trees to allocate each dollar spent to its respective category and driver. This step is critical to get everyone onto the same page (literally) and achieve an early buy in. We then identify inefficiencies (bad costs) and separate them from activities that generate customer value, stimulate growth and allow differentiation from competitors (good costs). Most effort is spent on understanding the drivers of bad costs, so they can be systematically eliminated, reduced, or controlled.
How long it takes:
The strategic cost reduction program consists of five modules to cover five cost reduction strategies. The first month is used to collect data and analyze the cost structure. Activities include cost benchmarking against competitors, conducting workshops, interviews, and surveys to develop the cost model and implementation roadmap. After the baseline is firmly established, cost reduction strategies are scheduled, starting with demand management for 3 months, followed by process efficiency for 6 months, technology alignment for 1 year, organisational agility for 2 years, and business model effectiveness for 4 years. Strategies can be implemented sequentially or also in parallel, while the latter draws significant amount of resources and requires strict coordination to implement change across functions and hierarchical levels. Each implementation sprint delivers bottom-line savings, while the full-scope program creates a continuous stream of cost reductions for several years.
Who is involved:
Members of the leadership team, representing all functions and teams in scope of the program, especially finance, procurement, supply chain, operations, engineering, and commercial. The project sponsor and project controller will be assigned internally by you, the client, while Leanmap provides the right level of external support to ensure success. Acting as analyst (“light touch”) or program leader (“strong touch”), we are filling skill and resource gaps, making sure savings are not only identified but also realized. People who should attend include executives, managers, leaders, chief financial officer, controllers, people who approve budgets, engineers, accounting personnel, supervisors, purchasing staff, sales and marketing representatives, people who define budgets, people responsible for largest spend-categories, business owners, and all people with an interest to allocate and consume resource in a value-adding way.
What you can expect:
Not less than $50,000 and up to $100 million per operating site (semiconductors). A 20%-reduction of bad costs is a common achievement, equivalent to 5% of the addressable cost base, assuming bad costs account for one quarter of the total. In addition, freed-up resources can now be reassigned to areas where they add more value, such as innovation and growth. And yes, even the most financially distressed companies have such cost transformation opportunities.
How much it costs:
As a rule of thumb, 1 full-time expert is required to identify and implement $1 million cost savings per year, assuming a $20M addressable cost base or higher. To insure a successful implementation, the leadership team needs to dedicate 10-20% of their time to the program, removing identified barriers, “cutting the fat” and “greasing the wheels”, while Leanmap provides external support at the right role and level of control per the Engagement Model.
Cost Reduction Workshop "Cost Storming" to Identify Opportunities, Commit to Cost Reduction Plan
During a 2-day session we train your team in cost reduction techniques (day-1) and then applying the learning (day-2) to understand the cost structure and test assumptions before committing to any cost savings or profit improvement. At the end of workshop, we present the findings to the leadership team and jointly decide how to proceed. The Cost Storming training and improvement sessions are based on 40 years cross-industry experience, reducing costs for manufacturers and service providers in 30+ countries.
- Team understands the importance of profitability
- Hidden losses and profits opportunities identified
- Ways to overcome physical and mindset barriers
- A profit project plan for each participant created
- Clear mechanism to to convert opportunity to action
- Understand profit drivers and how to influence them
- Trained staff, engaged in cost reduction as part of their jobs
- Profit projects with a dollar values and implementation plans
- Profit improvement policies, procedures, governance that fit your needs
- Not less than $50,000 and up to $100 million identified per operating site
Here are the actual results of a two-day Cost Storming workshop for a medium-size food-manufacturer to build a world-class cost reduction and profit improvement process. The attendees worked through the process of identifying, evaluating and processing profit improvement ideas. Achievements in numbers:
- 87 reduction targets identified
- 54 projects defined and approved
- $2.6 million bottom line or +52% earnings
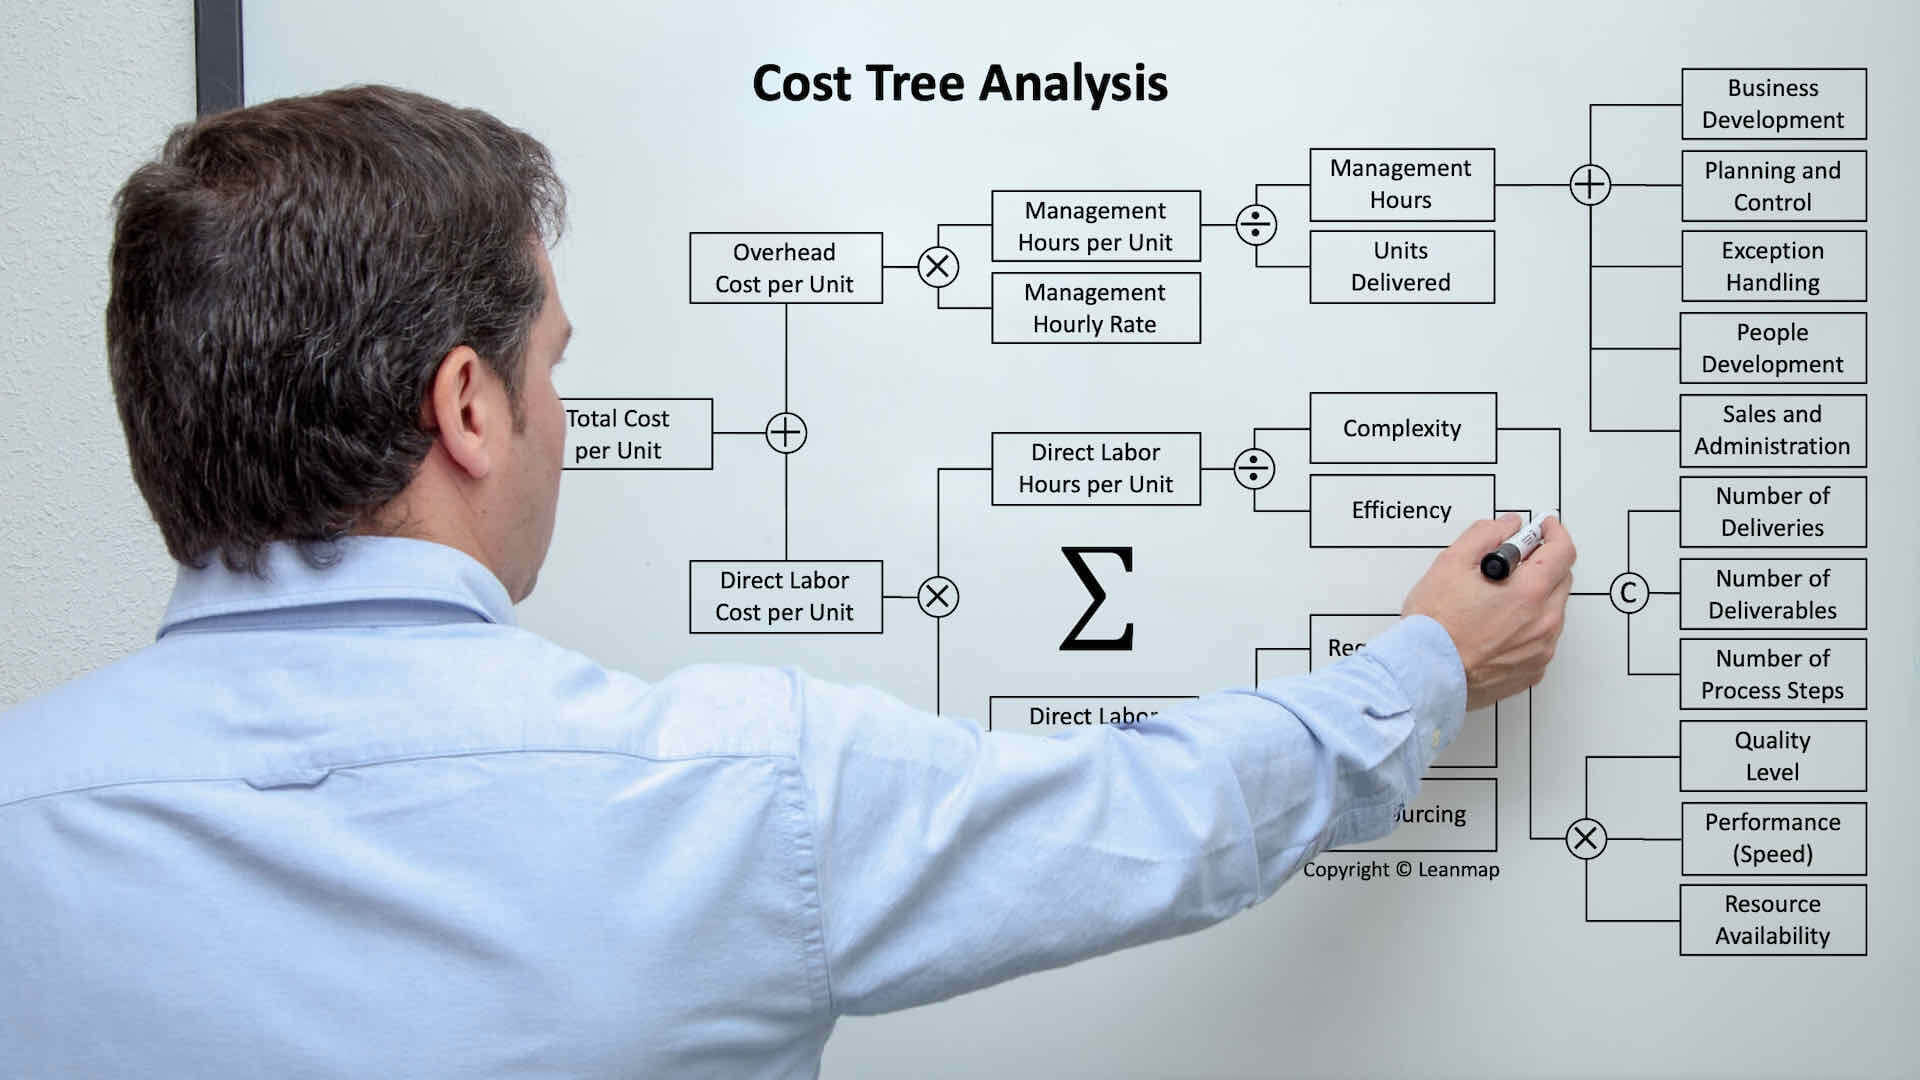
Analyzing Cost Structures Using Cost Trees
Cost is an outcome; the result of the applied structure, methods, requirements, and capabilities. This means, to effectively reduce costs, the structure with its underlying processes and systems must be well understood, so that that the right actions can be defined that directly impact cost drivers. Here an example of an actual cost tree for a service process. The model is for illustration and can be adjusted to fit a broad range of service businesses, such as accounting, purchasing, education, maintenance. If you are interested to learn about the power of logic trees for cost and root-cause analysis, explore the course in Expert Problem Solving.
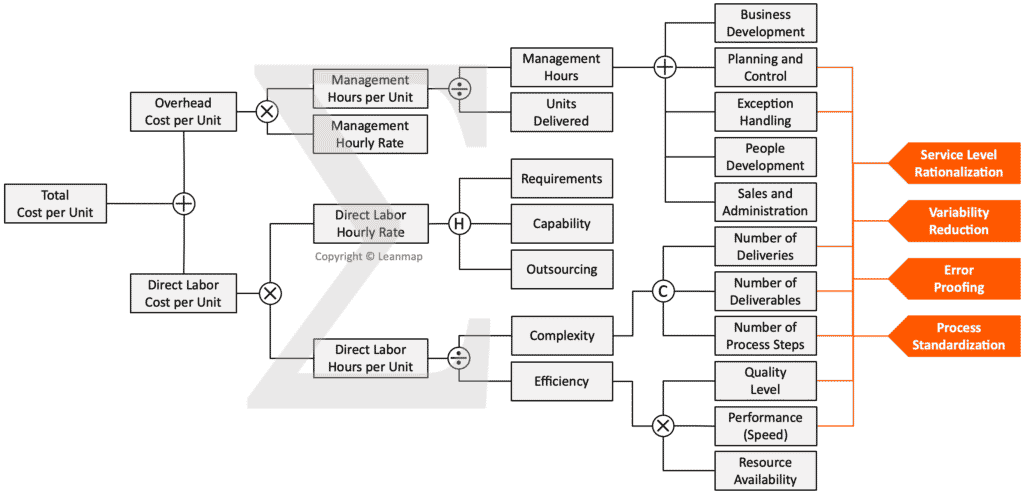
Driving Cost Reduction Through Logic Trees
A logic tree is an excellent tool not only to identify levers and allocations, but also to determine effective cost reduction actions:
- Define cost structure by breaking down the overall costs into its components, using a mathematical operator between any two boxes (multiply, divide, add, subtract). Doing so creates a logical connection (formula) between elements.
- Identify cost drivers, the factors that creates the cost of each activity; the root cause of why a particular cost has occurred. Activities consume resources while customers, products, processes, and value streams consume activities.
- Identify improvement activities that directly influence cost drivers by reducing the amount or the frequency of consumption. Also consider the elimination, consolidation, substitution, of parts and activities being consumed.
- Lower the cost base by implementing improvement actions, while monitoring their impact across the logic tree. For example: error-proofing > improves quality > improves efficiency > reduces labor hours > reduces labor cost > reduces cost of service.
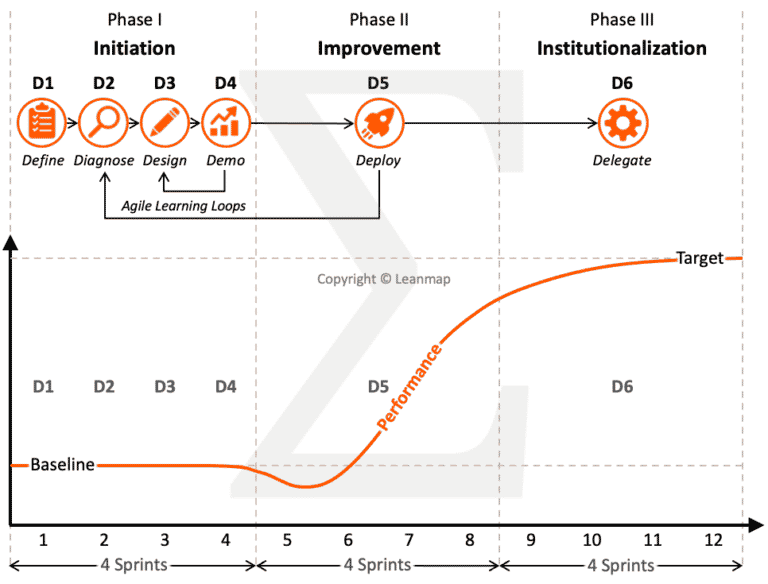
Cost Reduction Process in 6 Stages
Our 6D-process helps to structure cost-reduction efforts into 6 “D”-phases and 12 implementation sprints. Doing so keeps people focused and the cost reduction program on track, ensuring that cost savings are not only discussed but also delivered to the bottom line. Review gates at the end of each phase ensure the deliverables per cost reduction roadmap are being met.
- Define the problem, align on goals and scope, create the project charter, ensure commitment and communicate it to stakeholders.
- Diagnose the current state, identify cost drivers and allocations, confirm the baseline and quantify the improvement opportunity.
- Design the future state based on balanced resources, reduced waste and variability, aligned technology, and right-sized organization.
- Demonstrate effectiveness in a pilot area, prototype testing at limited scope in a relevant environment to evaluate assumptions.
- Deliver improvements by scaling up; reconfiguring processes, systems, job-descriptions, team-structures, and spans of control.
- Delegate ownership and validate impact, while implementing standards and training people to sustain the new way of working.
Key to Sustainable Cost Reductions
Quick-fix approaches, such as rapid cost cutting, generally do not work or not for long. When fewer people do more of the same work, it will deteriorate productivity, quality, morale with serious consequences. Costly errors quickly offset savings in the short term and lack of innovation erodes organizational health and competitiveness in the long term. Successful cost-reductions require deep-rooted change, a redesigned cost structure, efficient processes, and skilled people to implement and sustain them. Contact us to develop a cost reduction program that works for you.
$500+ Million Sustainable Cost Improvements from Financial Excellence Programs at 10 Clients

Semiconductors: Cost-per-Move Reduction to Save the Budget
Cost Savings Program (CSP) for a major chip manufacturer reduces Cost-Per-Move (CPM) through adaptive maintenance, systematic barrier removal, and rigorous performance management by $118 million.

Food Flavors: Journey to World-Class Efficiency
Lean Transformation Program (LTP) for the largest food flavor and fragrance company to streamline operations end to end, achieving industry-leading profitability from world-class operating efficiency.

Power Electronics: Complexity Cost Reduction
Cost Reduction Program (CRP) for Eltek, a global electric power conversion specialist, to reduce the cost base by optimizing interfaces between engineering, operations, and sales.

Transport & Logistics: Cost Reduction Program
Cost Reduction Program (CRP) for a large industrial multinational with focus on transport and logistics, delivering $15 million annualized savings within the first 4 months.
Diesel Engines: Warranty Cost Reduction
Quality Excellence Program (QEP) for large engine manufacturer to improve process capability and product reliability, resulting in $59 million warranty cost reductions in 7 months.

Airline Catering: Labor Productivity Cost Reduction
Cost Reduction Program (CRP) for global airline caterer to meet top-down profitability target by transforming seven factories with focus on planning, manning, manufacturing and logistics.