The Quality Excellence Program (QEP) helps clients reduce variability in products and processes to meet customer needs first time, turning defects into profits.
Addressing the sources of variability and defects is critically important when the failure rate is excessive or warranty obligations hurt profitability. The Quality Excellence Program helps business leaders, quality managers, and functional specialists to systematically improve process capability and consistently meet customer requirements at lowest non-performance cost.
Cases, when to use it:
- Burning money on defects, delays, variability
- Increasing customer complaints, returns, aggravations
- Losing trust in people, processes, products, leadership
Clients, for whom it is:
- Business leaders (CEO, COO, CFO)
- Quality responsible (QM, QA, QC)
- Engineers and process specialists
Process, how it works:
- Develop the driver-model for defects and variability
- Identify causes at physical, human, and system level
- Develop quality excellence program for zero defects
Benefits, what to gain:
- Containments to stop the bleeding
- Corrections to get back to normal
- Preventions to protect the future
Creating the Conditions for Perfect Quality from Zero Defects
Quality Excellence Program
Why Is Quality Important?
Quality is critical to satisfy customers and keep costs under control. Superior products and services command higher prices and significantly contribute to long-term revenue and profitability, making quality is a key differentiator in a crowded market. Continuous quality improvement is therefore a prerequisite for long-term success.
What Is Quality Actually?
Quality is a degree of excellence, the fitness for intended use, the ability to fulfill customer needs (→ Quality Philosophy). Non-quality therefore is any deviation from the specification, expectations, or standard, such as a rejected proposal, missed goal, overdue decision, late delivery, lost order, healthcare failure, or returned package. Defects hurt profitability in the short-term and erode competitiveness long-term. Quality champions consider defects as opportunities, improving bottom-line profitably by eliminating poor quality.
What is Quality Excellence?
Quality implies a certain level of success in meeting customer needs, creating products and services that meet specifications and expectations, and comply with applicable standards. Excellence refers to an internal drive to become the best. Quality Excellence (QE) therefore, is the drive to become a leader in quality.
What Are the Challenges?
The two Quality Challenges faced by any manufacturer and service provider are (a) Reducing variability when customer requirements are not met and (b) Reducing quality cost when customer requirements are consistently being met, and process capability is established. Solving these two quality challenges is an investment in the future, and a top priority when failures erode profitability and undermine long-term sustainability.
What Is a Quality Excellence Program? How Does It Work?
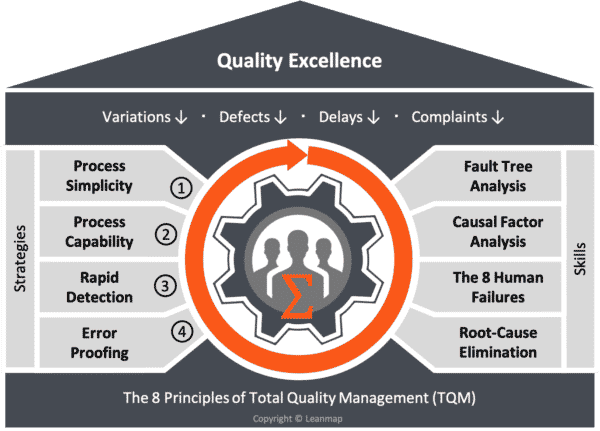
To be effective, a quality program must address the causes for variability, defects, and the quality costs. Our Quality Excellence Program (QEP) helps client organizations improve performance, move towards zero-defect capability by addressing excessive complexity, process instability, ineffective control, and the eight causes of human failure. It establishes the critical-to-quality (CTQ) parameters that must be controlled to ensure consistent outcomes within specified tolerances, while reducing the cost of poor quality (COPQ) that elevates the bottom line.
How Long Does the Program Take?
By using a series of analysis and trials, straight-forward problems can be addressed within a single improvement sprint; a week to optimize one critical-to-quality (CTQ) parameter and several weeks to address interaction effects. Broad and deep-rooted problems require several weeks to identify and eliminate root-causes at the physical, human, and latent level → Problem Solving. A 90-day project allows addressing a complete cross-functional failure tree at the corporate level. As a rule of thumb, we schedule one month per function, entity, or major stakeholder involved.
Who Must Be Involved? Who Is Leading?
Functional managers, process experts, and experienced operators are key members of the improvement team. A project sponsor and project controller must be assigned to drive the program internally, while Leanmap provides external support. Acting as an analyst, problem solver, or interim Q-eader (→ Engagement Model), we provide the critical knowledge and fill resource gaps to bring the level of first-time-right (FTR) in line with expectations.
How Much Does it Cost?
Defects hurt profitability in the short term and erode competitiveness in the long term. Consequently, every root-cause eliminated and every error-trap implemented reduces failure costs. Our defect-reduction program is not only self-funding but contributes to the bottom line by generating savings from fewer defects, freeing up people, capacity, and capital (e.g. released buffer and safety stock). For the support we provide, every dollar you spend in consulting fees, we identify 10x to 30x improvement potentials. Typical ROI of such projects is 11x (→ 6D Process).
What Are the Benefits?
Improvement effort always pays off. Our zero-defect program creates better outcomes for all stakeholders: better products for customers, better care for patients, stable processes for employees, and healthy returns for investors. Training your staff in process control and systematic problem solving ensures the critical skills are in place to continuously cut defect rates in half each year, until the desired level of Quality Excellence is achieved.
The 4 Strategies to Achieve Zero Defects
The path to Quality Excellence requires implementing four distinct strategies, each reducing defect rates by 10x, or 1000x overall. Applying these strategies dramatically improves the performance of manufacturing and service processes, including product development, customer service, transportation, utilities, and healthcare.
1. Process Simplicity
- Defects increase with the difficulty and duration of a task. Process complexity is therefore a cause of both, variability and mistakes, that result in defects.
- By changing the process so that fewer or simpler steps are needed, we reduce the probability of omitting a critical step or uncontrolled variation in a procedure.
- Simplification reduces defects at their source. It must occur first because it is extremely difficult to change a process after it has been institutionalized. It is the main reason why simplification is addressed ahead of variability, speed, and mistakes to bring defect rate to 10% or less.
2. Process Capability
- Defects increase with variability from instable processes and uncontrolled interactions with the operating environment, such as the inability to hold tolerances.
- Variability is addressed using statistical methods (SQC, SPC) to make processes more stable. It requires an understanding of the science behind processes and also the analysis of variance.
- Establishing process capability by controlling the characteristics of the product or service, while eliminating the causes of excessive variations brings defect rate down from 10% to 1%.
3. Rapid Detection
- Defects increase with batch size and problem-detection time. The longer it takes to catch a problem, the more often a defect can be reproduced.
- Problem detection time is minimal when moving from batches to sequential processing (FIFO) using cells and flow lines. It provides instant feedback on infrequently occurring discrete events like tool breakage or mislabeled parts.
- Separating unprocessed from completed work prevents reproducing defects, while rapid detection brings defect rate down from 1% to 0.1%.
4. Error-Proofing
- Defects are also caused by human mistakes and errors, such as omitting steps, doing them incorrectly, or processing them in the wrong order.
- Mistakes cannot be controlled by statistical methods that focus on variability. We therefore need to implement error-traps, go/no-go fixtures, and inline validation checks.
- Because mistakes are inevitable and their consequences are often severe, they must be prevented. Protecting the process from human mistakes, using error-traps and validation checks brings defect rate further down from 0.1% to 0.01%.
Total Quality Principles Are the Foundation of any Quality Improvement Program
What is Total Quality Management?
TQM is a management framework for continuous quality improvement to satisfy customer needs and deliver value to stakeholders.
- Total implies that all employees of an organization are involved to improve all processes, from identified need to its fulfillment.
- Quality is fitness for intended use, covering all features and characteristics of a product or service to satisfy customer needs.
- Management refers to a focused effort, providing funding, training, staffing, direction to manage outcomes and achieve goals.
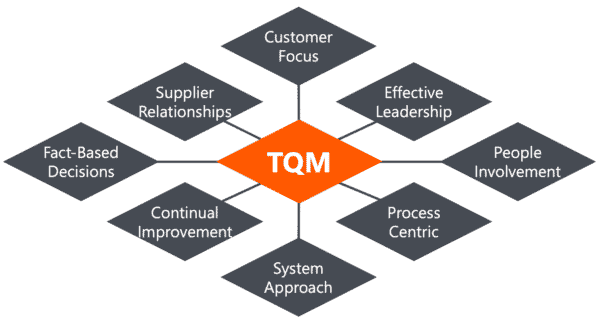
The 8 Principles of TQM
To promote a total quality culture in the client-organizations we work with, we align our programs with the eight Total Quality Management principles that have been defined by the International Organization for Standardization (ISO), the Technical Committee 176 (TC 176), responsible for quality management and quality assurance. Those principles are:
Principle 1: Customer Focus
Organizations depend on their customers, must understand and meet their customers current and future needs.
- Understand their needs
- Meet their requirements
- Strive to exceed their expectations
Principle 2: Effective Leadership
Leaders establish unity of purpose and direction, while creating an environment in which people can achieve goals.
- Establish direction
- Provide training
- Ensure funding and staffing
Principle 3: People Involvement
Get all people engaged and committed, so they can fully contribute, ensuring that their abilities are used for the organization’s benefit.
- Involve everyone
- Empower people
- Create a conducive work environment
Principle 4: Process Centric
The desired result is achieved more efficiently when related resources and activities are managed as a process.
- Establish process capability
- Systematically reduce variations
- Monitor performance to detect abnormalities
Principle 5: System Approach
Identifying, understanding, and managing interrelated processes improves the organization’s effectiveness and efficiency.
- Standardize processes
- Establish rules and limits
- Address deviations
Principle 6: Continual Improvement
Never-ending improvement must be a permanent objective of an organization to sustain success in the long term.
- Challenge the status quo
- Evolve best-known practices
- Raise target faster than competitors
Principle 7: Fact-Based Decisions
Effective decisions and actions are based on the analysis of data and information.
- Strategy based on opportunities and tradeoffs
- Tactics based on projected return on investment
- Operational decisions based on performance data
Principle 8: Supplier Relationships
An organization and its suppliers are independent, and a mutually beneficial relationship enhances the ability to create value.
- Create partnerships
- Align strategies
- Connect value streams
Reactive Quality Management
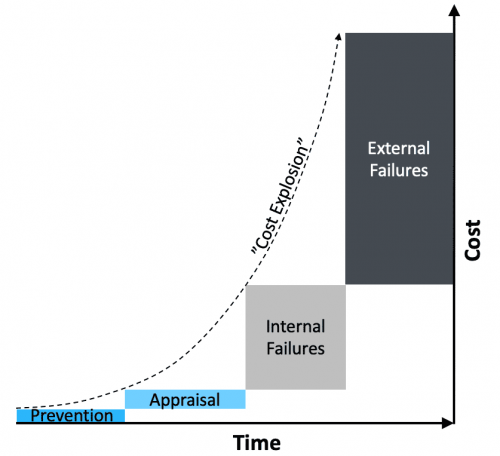
Problem: dealing with failures once they have occurred and costs already “exploded”
Costs balloon by a factor of 10x each time a problem escapes detection. Quality excellence therefore requires shifting focus upstream, allocating resources to controllable quality costs:
- Error-proofing (prevention cost)
- Failure detection (appraisal cost)
Quality Excellence Management
Solution: dealing with variability early to prevent costly failures downstream
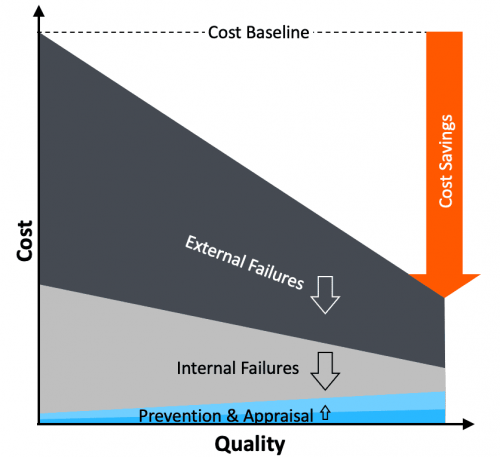
Quality excellence means front-loading efforts, controlling critical-to-quality (CTQ) parameters upstream, so that major failures can be prevented downstream, significantly reducing resultant quality costs:
- Scrap and rework (internal failure cost)
- Returns and claims (external failure cost)
Analyze Quality Costs to Prioritize Improvement Actions
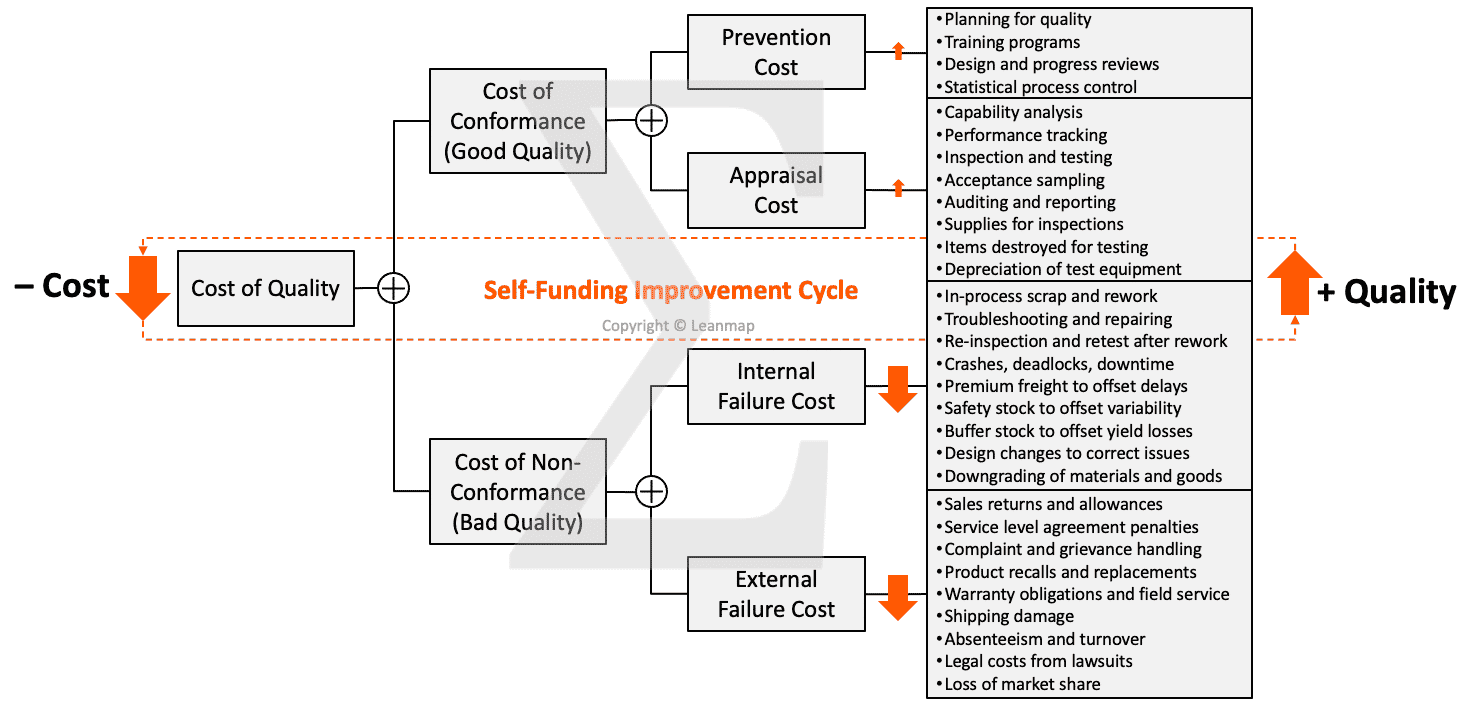
Quality Costs are those associated with preventing, detecting, and remediating problems to meet the expectations of a customer, the good and bad quality costs:
- Cost of Conformance to ensure good quality:
- Prevention Cost involves all activities to minimize the potential for defects, including planning for quality, operator training, design and progress reviews, statistical process control, and supplier certification.
- Appraisal Cost involves all activities to detect problems early; it covers labor and overhead for capability analysis, performance tracking, inspection and testing, acceptance sampling, auditing and reporting, supplies required for inspections, items destroyed for testing, depreciation and maintenance of test equipment.
- Cost of Non-Conformance to correct bad quality:
- Internal Failure Cost involves all activities to detect a defective item that needs to be reworked and retested or scrapped if deemed unusable; it covers in-process scrap and rework, trouble-shooting and repairing, re-inspection and rest after rework, as well as crashes, deadlocks, breakdowns, downtime, premium freight to offset delays, safety stock to offset process variability and inflexibility, buffer stock to offset yield losses, design changes to correct product instabilities, downgrading of materials and goods because of imperfections.
- External Failure Costs involves all activities to deal with a defective item that reached the customer, including sales returns and allowances, service level agreement penalties, complain and grievance handling, product recalls and replacements, warranty obligations, field service, shipping damage, absenteeism and employee turnover, legal costs from lawsuits, loss of market share.
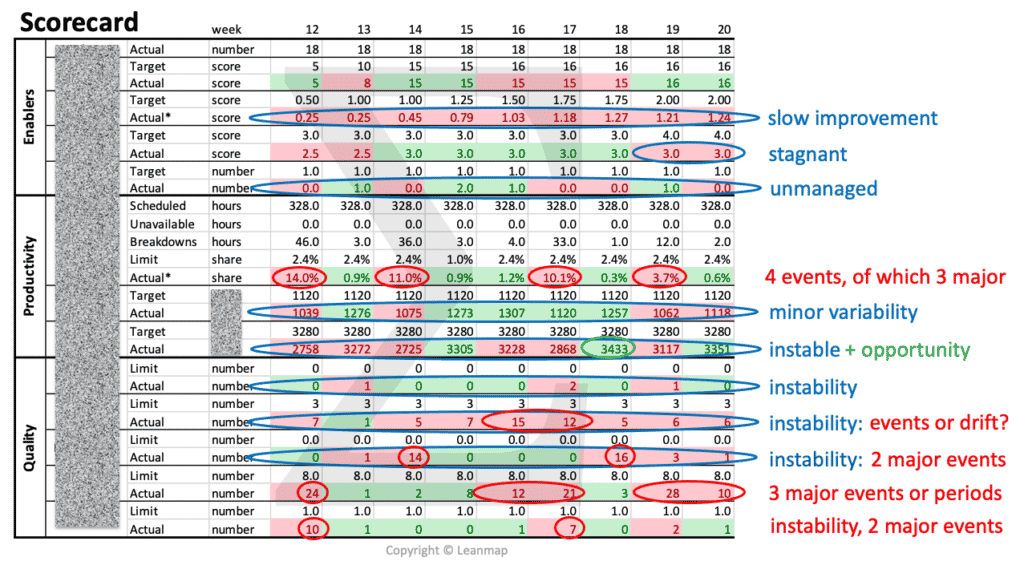
Quality Performance Review Based on Scorecard to Identify Abnormalities
The balanced scorecard is a strategic planning and management tool to communicate plans and targets, schedule resources, prioritize quality improvement actions, and monitor progress towards strategic quality targets. The scorecard is “balanced” when reviewing operational measures and performance enablers, in addition to financial measures. The framework gives an organization a way to “connect the dots” between quality planning, performance measurement, performance management, and impact verification based on key performance indicators (KPIs) to accomplish the quality mission, vision, and strategy. Below an example of an manufacturing scorecard that focuses on three areas of performance improvement:
- Enablers: skill score, workplace organization, problem-solving effectiveness
- Productivity: units per man-hours, units per machine-hour, output per week
- Quality: abnormalities, rejects, scrap, downtime, and customer complaints
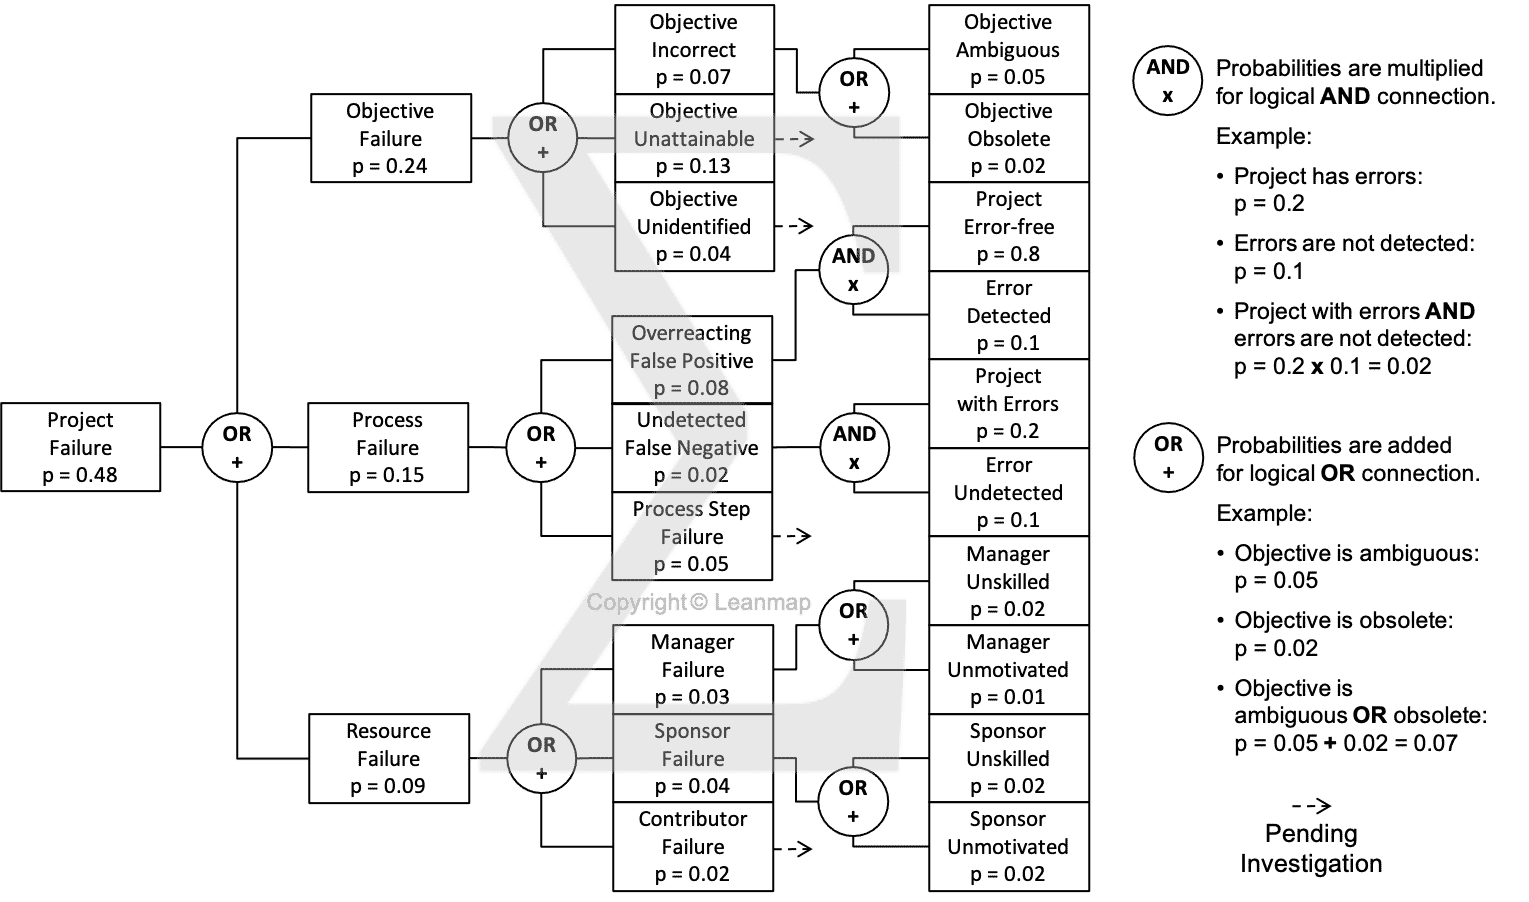
Project Failure Analysis to Identify Root Causes Using the Defect Tree
The logic tree is a key tool to analyze defects, uncover their causes, and develop quality improvement actions. The example below analyzes the causes for unsuccessful projects: 48% projects failed due to defects in objectives (24%), processes (15%), and resourcing (9%). The analysis shows that ambiguous objectives caused 5% project failures. By clarifying objectives, using the SMART framework, this cause can be effectively addressed in the quality improvement plan.
Quality Excellence in Health Care
Measuring and monitoring overall system performance is challenging and complex but critical to improve the quality of patient care. Doctors and hospitals are increasingly being held accountable to develop actions aimed at improving the quality of care, reducing costs, and achieving better patient-centered care. This following QI project case describes how to analyze a clinical care issue and steer quality improvement efforts to achieve better patient outcomes.
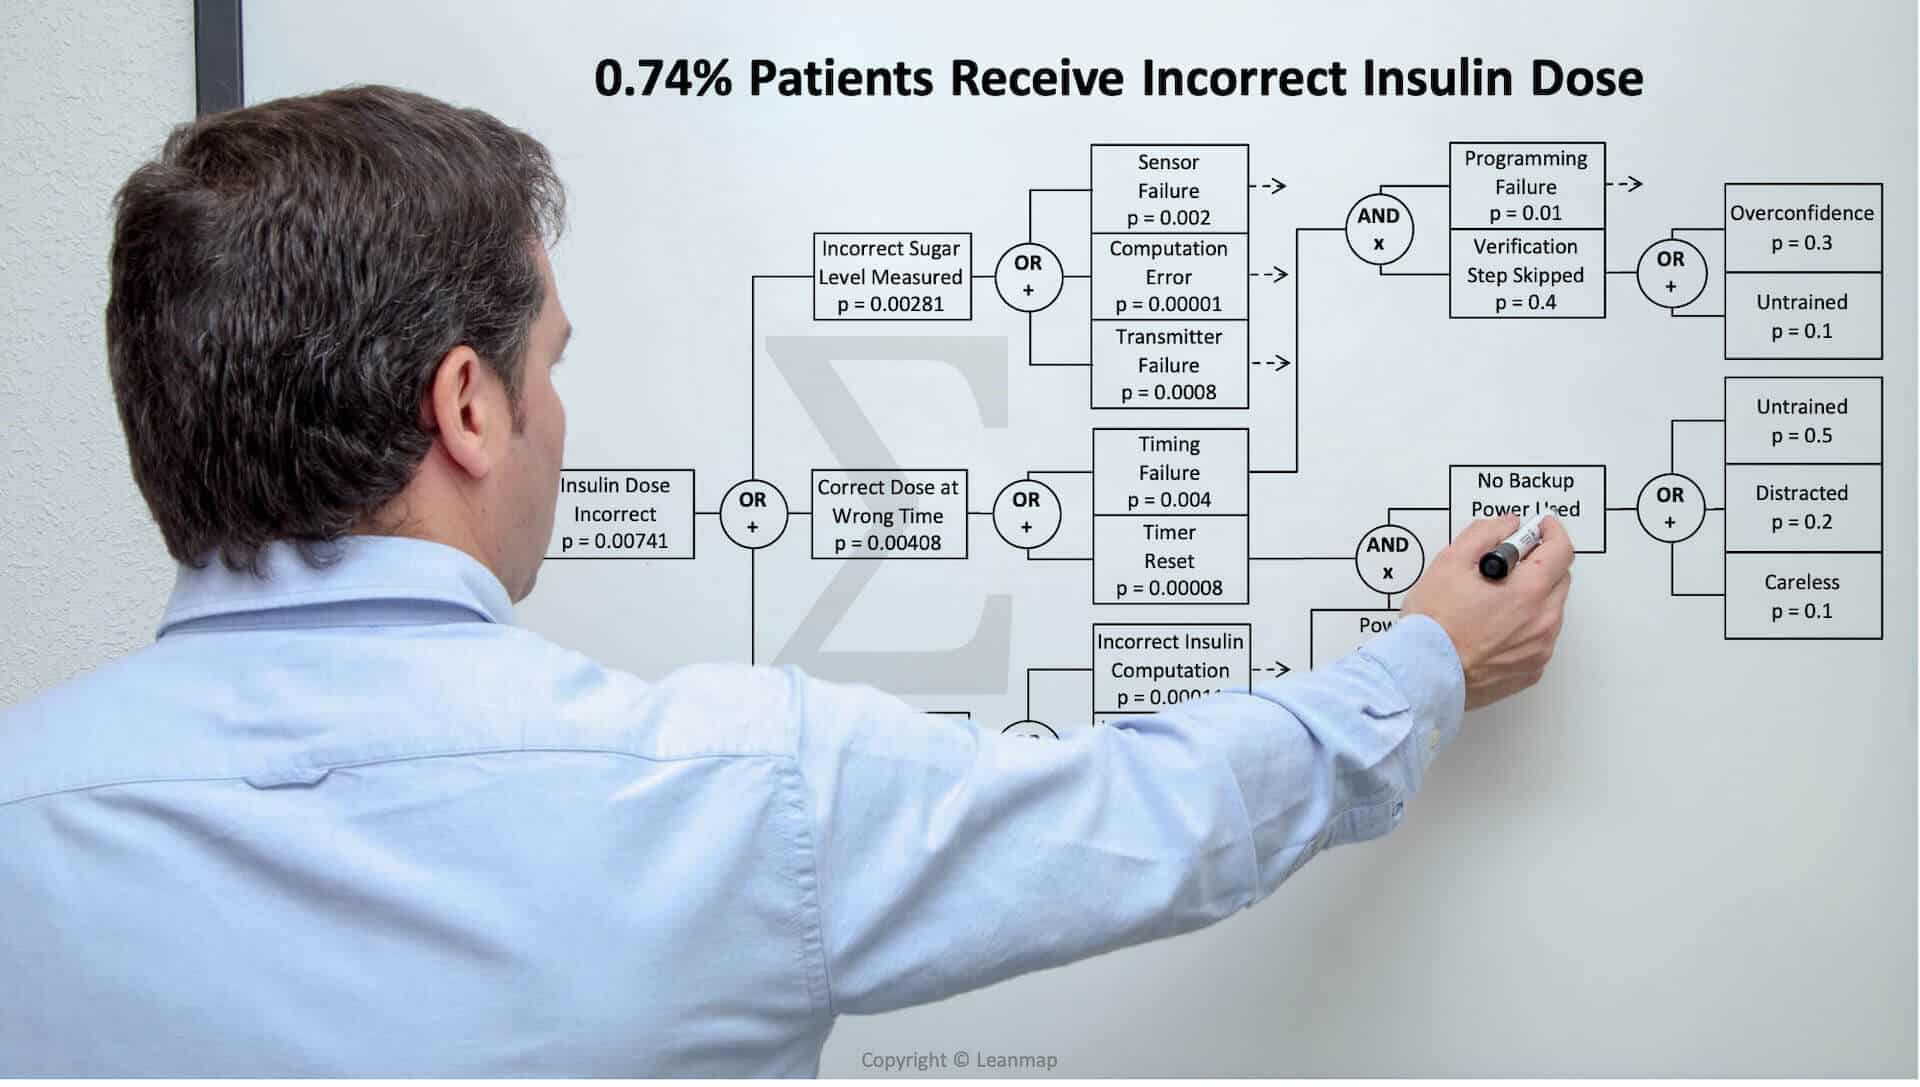
Incorrect Insulin Dose Administered to 0.74% Patients
The fault tree analysis shows three physical causes for administering the incorrect insulin dose: (a) incorrect sugar measurement from sensor failure, computation error, or transmitter failure, (b) correct dose administered at the wrong time because of timing failure or timer reset, and (c) delivery system failure because incorrect insulin computation, incorrect pump signal, or pump failure. When investigating the timing failure, we found it was caused by a combination of programming failure and verification step skipped. And skipping the verification was due to overconfidence or lack of training. And the timer reset was caused by a power outage and the failure to connect the backup power, which was caused by the health care worker being distracted, careless, or overconfident that a power outage will not happen. By analyzing the causes at the physical, human, and latent level, we help clinicians to develop effective countermeasures that improve patient safety and overall health care quality by 10x to 100x.
Systematic Defect Reduction Lowers Costs and Complaints in Manufacturing and Health Care

Materials: Solving Bottlenecks to Boost Throughput
Overall Equipment Effectiveness (OEE) improvement of printed circuit board production through systematic elimination of 68% flow-stoppers in just two months using Fault Tree Analysis (FTA).

Beverage Production: PDCA Cuts Non-Quality Costs
Quality Excellence Program (QEP) for a global ingredients manufacturer to reduce first-time-incorrect (FTI) rate of product mixes delivered to the world’s largest non-alcoholic beverage companies.

Energy Metering: Quality Program Cuts Cost
Quality Excellence Program (QEP) for a global energy metering company with focus on product reliability to reduce field-failure rates and costs for warranty and repair.
Quality Culture Check
Ask the following eight questions to asses the current quality culture and management system. Score each question based on the level of agreement: low=1, medium=2, high=3. Maximum score is 8×3 = 24. For example, a score of 18 indicates that the current condition is 18/24 = 75% effective, leaving a 25-point gap to be addressed through continuous improvement activities.
1. Customer: I understand my customer and how to provide good quality.
2. Policy: I am familiar and agree with my company’s quality policy.
3. Priority: My manager’s action and attitude tell me that quality is important.
4. Metric: I can measure quality in my area of responsibility, can provide daily figures.
5. Output: My department consistently provides top-quality products and services.
6. Feedback: I am getting regular feedback on the quality of my work, at least monthly.
7. Appraisal: Achieving quality objectives affects my performance evaluation.
8. Improvement: I was a member of a quality improvement team in the past 12 months.
Terms & Tools
Continuous Quality Improvement is a management method that encourages stakeholders, including suppliers, customers, employees, and owners to continuously ask “How are we doing?” and “Can we do it better?”. Even though CQI focuses on people, the actual root-cause analysis and QI project is based on data → Problem Solving Skills.
Cost Driver Trees are used to bring those costs to the surface, so they can be systematically addressed. By doing so, controllable costs mildly increase (for prevention and appraisal), while resultant costs fall as a result (to rectify internal and external failures). Part of the cost savings can now be reinvested to further evolve the system, increase capability and stability, and reduce overall quality costs, creating a self-funding improvement cycle.
Non-Conformance Costs can grow to a major portion of the total business expenses. Problem is that those costs are usually hidden deep in the accounting system, which is more oriented toward recording costs by department (e.g. headcount) rather than driver (e.g. rework). In such a case, quality costs are buried within variance accounts by inflating labor rates, adding buffers, shrinkage and yield losses.
Quality Assurance ensures that processes produce desired outcomes; quality assurance is based on two principles: “fit for purpose” and “right first time”.
Quality Control is about ensuring that goods and services meet specifications through inspecting and testing. Per ISO9000, quality control is a part of quality management focused on fulfilling quality requirements.
Quality Costs can arise anywhere in a company, such as a data-entry mistake by the sales department that causes the customer receive the wrong item, a poorly designed product by engineering that wiped out the profit margin, an assembly error by manufacturing that caused a product flaw, a handling mistake by the logistics department that caused the wrong item shipped, substandard materials sourced by the procurement department that resulted in excessive scrap and yield losses, a failed strategy that resulted in a major loss of market share.
Quality Improvement is the ongoing assessment of current practices so they can be tweaked or changed for better and better results over time. A quality improvement program involves all activities that are organized and implemented by an organization to monitor, assess, and improve the quality of its products and services. Most QI plans are based on the PDCA cycle (plan-do-check-act) or PDSA cycle (plan-do-study-act) to achieve measurable improvement. The PROFIT quality improvement process is more specific than the traditional PDCA cycle, using six instead of four steps. If the desired results are not met, the cycle is repeated. The PROFIT models can be used for problem solving, performance management, and continuous quality improvement. In organizations that follow Total Quality Management (TQM) principles, the chosen model should be consistently used by every team and function.
- P = Problem definition
- R = Root cause identification and analysis
- O = Optimal solution based on root causes
- F = Finalize how the corrective action will be implemented
- I = Implement the plan
- T = Track the effectiveness and verify desired results are met
Quality Planning creates the quality plan, a structured document that defines policies, procedures, and measures to gauge your quality management efforts.
Quality Policies include all rules and regulations about what quality looks like and does not look like for your company as well as how you respond to make things right when quality falls short.
The Seven Quality Tools
Emphasized by Kaoru Ishikawa, a professor of engineering at Tokyo University, and implemented by Japan’s industrial training program during the country’s postwar period to provide basic, user-friendly tools that workers from various backgrounds with varied skill sets could implement without extensive training. Today, these quality management tools are still considered the ‘gold standard’ for addressing quality issues, therefore integral part of continuous improvement processes, such as Six Sigma, TQM, and Lean management.
1. Cause-and-Effect Diagram (Ishikawa or fishbone diagrams): Identifies possible causes for an effect or problem and sorts ideas into useful categories.
2. Check Sheet: A structured form for collecting and analyzing data; a generic tool that can be adapted for a wide variety of purposes.
3. Control Chart: A graph to study performance over time. Comparing current data to historical control limits allows concluding if the process variation is consistent (in control) or unpredictable (out of control), affected by special-cause variations.
4. Histogram: Graph for showing frequency distributions, how often each value in a set of data occurs.
5. Pareto Chart: A bar graph that shows which factors are more significant; e.g. the top 20% causes are responsible for 80% effects.
6. Scatter Diagram: A graph pairing numerical data, one variable on each axis, to identify a relationship, e.g. correlation.
7. Stratification: A technique that separates data gathered from a variety of sources so that patterns can be identified by person, process, product, or period.

